prometheus+grafana+alertmanager监控k8s无坑版
摘要
k8s搭建完成并正常使用的基础上,需要有一个动态存储
我的环境:
k8s版本 | Kubeadm部署 v1.18.0
——– | —–
k8s-master | 172.22.254.57
k8s-node1 | 172.22.254.62
k8s-node2 | 172.22.254.63(nfs服务端)
StorageClass | nfs-storage
k8s-master有污点,如果需要监控到master,去除污点即可(非必要)
1
| kubectl taint nodes node1 key1=value1:NoSchedule-
|
prometheus-rules中的规则字段可能随着版本更新出现变化,如有变化可以通知我,我实时更新文档。目前规则内的字段在此版本我已更新过。放心使用
还有一个小细节:prmetheus跟alertmanager的configmap是支持热更新的。可以用以下命令来热更新,可能执行刷新的时候会有点儿久,等一下就好
1
| curl -X POST http://ClusterIP:PORT/-/reload
|
资源下载:https://github.com/alexclownfish/k8s-monitor
部署正文
创建ops命名空间
prometheus yaml文件
prometheus配置文件 prometheus-configmap.yaml
1
2
3
4
5
6
7
8
9
10
11
12
13
14
15
16
17
18
19
20
21
22
23
24
25
26
27
28
29
30
31
32
33
34
35
36
37
38
39
40
41
42
43
44
45
46
47
48
49
50
51
52
53
54
55
56
57
58
59
60
61
62
63
64
65
66
67
68
69
70
71
72
73
74
75
76
77
78
79
80
81
82
83
84
85
86
87
88
89
90
91
92
93
94
95
96
97
98
99
100
101
102
103
104
105
106
107
108
109
110
111
112
113
114
115
116
117
118
119
120
121
122
123
124
125
126
127
128
129
130
131
132
133
134
135
136
137
138
139
140
141
142
143
144
145
| apiVersion: v1
kind: ConfigMap
metadata:
name: prometheus-config
namespace: ops
data:
prometheus.yml: |
rule_files:
- /etc/config/rules/*.rules
scrape_configs:
- job_name: prometheus
static_configs:
- targets:
- localhost:9090
- job_name: kubernetes-apiservers
kubernetes_sd_configs:
- role: endpoints
relabel_configs:
- action: keep
regex: default;kubernetes;https
source_labels:
- __meta_kubernetes_namespace
- __meta_kubernetes_service_name
- __meta_kubernetes_endpoint_port_name
scheme: https
tls_config:
ca_file: /var/run/secrets/kubernetes.io/serviceaccount/ca.crt
insecure_skip_verify: true
bearer_token_file: /var/run/secrets/kubernetes.io/serviceaccount/token
- job_name: kubernetes-nodes-kubelet
kubernetes_sd_configs:
- role: node # 发现集群中的节点
relabel_configs:
# 将标签(.*)作为新标签名,原有值不变
- action: labelmap
regex: __meta_kubernetes_node_label_(.+)
scheme: https
tls_config:
ca_file: /var/run/secrets/kubernetes.io/serviceaccount/ca.crt
insecure_skip_verify: true
bearer_token_file: /var/run/secrets/kubernetes.io/serviceaccount/token
- job_name: kubernetes-nodes-cadvisor
kubernetes_sd_configs:
- role: node
relabel_configs:
# 将标签(.*)作为新标签名,原有值不变
- action: labelmap
regex: __meta_kubernetes_node_label_(.+)
# 实际访问指标接口 https://NodeIP:10250/metrics/cadvisor,这里替换默认指标URL路径
- target_label: __metrics_path__
replacement: /metrics/cadvisor
scheme: https
tls_config:
ca_file: /var/run/secrets/kubernetes.io/serviceaccount/ca.crt
insecure_skip_verify: true
bearer_token_file: /var/run/secrets/kubernetes.io/serviceaccount/token
- job_name: kubernetes-service-endpoints
kubernetes_sd_configs:
- role: endpoints # 从Service列表中的Endpoint发现Pod为目标
relabel_configs:
# Service没配置注解prometheus.io/scrape的不采集
- action: keep
regex: true
source_labels:
- __meta_kubernetes_service_annotation_prometheus_io_scrape
# 重命名采集目标协议
- action: replace
regex: (https?)
source_labels:
- __meta_kubernetes_service_annotation_prometheus_io_scheme
target_label: __scheme__
# 重命名采集目标指标URL路径
- action: replace
regex: (.+)
source_labels:
- __meta_kubernetes_service_annotation_prometheus_io_path
target_label: __metrics_path__
# 重命名采集目标地址
- action: replace
regex: ([^:]+)(?::\d+)?;(\d+)
replacement: $1:$2
source_labels:
- __address__
- __meta_kubernetes_service_annotation_prometheus_io_port
target_label: __address__
# 将K8s标签(.*)作为新标签名,原有值不变
- action: labelmap
regex: __meta_kubernetes_service_label_(.+)
# 生成命名空间标签
- action: replace
source_labels:
- __meta_kubernetes_namespace
target_label: kubernetes_namespace
# 生成Service名称标签
- action: replace
source_labels:
- __meta_kubernetes_service_name
target_label: kubernetes_name
- job_name: kubernetes-pods
kubernetes_sd_configs:
- role: pod # 发现所有Pod为目标
# 重命名采集目标协议
relabel_configs:
- action: keep
regex: true
source_labels:
- __meta_kubernetes_pod_annotation_prometheus_io_scrape
# 重命名采集目标指标URL路径
- action: replace
regex: (.+)
source_labels:
- __meta_kubernetes_pod_annotation_prometheus_io_path
target_label: __metrics_path__
# 重命名采集目标地址
- action: replace
regex: ([^:]+)(?::\d+)?;(\d+)
replacement: $1:$2
source_labels:
- __address__
- __meta_kubernetes_pod_annotation_prometheus_io_port
target_label: __address__
# 将K8s标签(.*)作为新标签名,原有值不变
- action: labelmap
regex: __meta_kubernetes_pod_label_(.+)
# 生成命名空间标签
- action: replace
source_labels:
- __meta_kubernetes_namespace
target_label: kubernetes_namespace
# 生成Service名称标签
- action: replace
source_labels:
- __meta_kubernetes_pod_name
target_label: kubernetes_pod_name
alerting:
alertmanagers:
- static_configs:
- targets: ["alertmanager:80"]
|
kube-state-metrics 采集了k8s中各种资源对象的状态信息 kube-state-metrics.yaml
1
2
3
4
5
6
7
8
9
10
11
12
13
14
15
16
17
18
19
20
21
22
23
24
25
26
27
28
29
30
31
32
33
34
35
36
37
38
39
40
41
42
43
44
45
46
47
48
49
50
51
52
53
54
55
56
57
58
59
60
61
62
63
64
65
66
67
68
69
70
71
72
73
74
75
76
77
78
79
80
81
82
83
84
85
86
87
88
89
90
91
92
93
94
95
96
97
98
99
100
101
102
103
104
105
106
107
108
109
110
111
112
113
114
115
116
117
118
119
120
121
122
123
124
125
126
127
128
129
130
131
132
133
134
135
136
137
138
139
140
141
142
143
144
145
146
147
148
149
150
151
152
153
154
155
156
157
158
159
160
161
162
163
164
165
166
167
168
169
170
171
172
173
174
175
176
177
178
179
180
181
182
183
184
185
186
187
188
189
190
191
192
193
194
195
196
197
198
199
200
201
202
| apiVersion: apps/v1
kind: Deployment
metadata:
name: kube-state-metrics
namespace: ops
labels:
k8s-app: kube-state-metrics
spec:
selector:
matchLabels:
k8s-app: kube-state-metrics
version: v1.3.0
replicas: 1
template:
metadata:
labels:
k8s-app: kube-state-metrics
version: v1.3.0
spec:
serviceAccountName: kube-state-metrics
containers:
- name: kube-state-metrics
image: lizhenliang/kube-state-metrics:v1.8.0
ports:
- name: http-metrics
containerPort: 8080
- name: telemetry
containerPort: 8081
readinessProbe:
httpGet:
path: /healthz
port: 8080
initialDelaySeconds: 5
timeoutSeconds: 5
- name: addon-resizer
image: lizhenliang/addon-resizer:1.8.6
resources:
limits:
cpu: 100m
memory: 30Mi
requests:
cpu: 100m
memory: 30Mi
env:
- name: MY_POD_NAME
valueFrom:
fieldRef:
fieldPath: metadata.name
- name: MY_POD_NAMESPACE
valueFrom:
fieldRef:
fieldPath: metadata.namespace
volumeMounts:
- name: config-volume
mountPath: /etc/config
command:
- /pod_nanny
- --config-dir=/etc/config
- --container=kube-state-metrics
- --cpu=100m
- --extra-cpu=1m
- --memory=100Mi
- --extra-memory=2Mi
- --threshold=5
- --deployment=kube-state-metrics
volumes:
- name: config-volume
configMap:
name: kube-state-metrics-config
---
apiVersion: v1
kind: ConfigMap
metadata:
name: kube-state-metrics-config
namespace: ops
data:
NannyConfiguration: |-
apiVersion: nannyconfig/v1alpha1
kind: NannyConfiguration
---
apiVersion: v1
kind: Service
metadata:
name: kube-state-metrics
namespace: ops
annotations:
prometheus.io/scrape: 'true'
spec:
ports:
- name: http-metrics
port: 8080
targetPort: http-metrics
protocol: TCP
- name: telemetry
port: 8081
targetPort: telemetry
protocol: TCP
selector:
k8s-app: kube-state-metrics
---
apiVersion: v1
kind: ServiceAccount
metadata:
name: kube-state-metrics
namespace: ops
---
apiVersion: rbac.authorization.k8s.io/v1
kind: ClusterRole
metadata:
name: kube-state-metrics
rules:
- apiGroups: [""]
resources:
- configmaps
- secrets
- nodes
- pods
- services
- resourcequotas
- replicationcontrollers
- limitranges
- persistentvolumeclaims
- persistentvolumes
- namespaces
- endpoints
verbs: ["list", "watch"]
- apiGroups: ["apps"]
resources:
- statefulsets
- daemonsets
- deployments
- replicasets
verbs: ["list", "watch"]
- apiGroups: ["batch"]
resources:
- cronjobs
- jobs
verbs: ["list", "watch"]
- apiGroups: ["autoscaling"]
resources:
- horizontalpodautoscalers
verbs: ["list", "watch"]
- apiGroups: ["networking.k8s.io", "extensions"]
resources:
- ingresses
verbs: ["list", "watch"]
- apiGroups: ["storage.k8s.io"]
resources:
- storageclasses
verbs: ["list", "watch"]
- apiGroups: ["certificates.k8s.io"]
resources:
- certificatesigningrequests
verbs: ["list", "watch"]
- apiGroups: ["policy"]
resources:
- poddisruptionbudgets
verbs: ["list", "watch"]
---
apiVersion: rbac.authorization.k8s.io/v1
kind: Role
metadata:
name: kube-state-metrics-resizer
namespace: ops
rules:
- apiGroups: [""]
resources:
- pods
verbs: ["get"]
- apiGroups: ["extensions","apps"]
resources:
- deployments
resourceNames: ["kube-state-metrics"]
verbs: ["get", "update"]
---
apiVersion: rbac.authorization.k8s.io/v1
kind: ClusterRoleBinding
metadata:
name: kube-state-metrics
roleRef:
apiGroup: rbac.authorization.k8s.io
kind: ClusterRole
name: kube-state-metrics
subjects:
- kind: ServiceAccount
name: kube-state-metrics
namespace: ops
---
apiVersion: rbac.authorization.k8s.io/v1
kind: RoleBinding
metadata:
name: kube-state-metrics
namespace: ops
roleRef:
apiGroup: rbac.authorization.k8s.io
kind: Role
name: kube-state-metrics-resizer
subjects:
- kind: ServiceAccount
name: kube-state-metrics
namespace: ops
|
prometheus部署文件 prometheus-deploy.yaml(注意版本需要用2.20)
1
2
3
4
5
6
7
8
9
10
11
12
13
14
15
16
17
18
19
20
21
22
23
24
25
26
27
28
29
30
31
32
33
34
35
36
37
38
39
40
41
42
43
44
45
46
47
48
49
50
51
52
53
54
55
56
57
58
59
60
61
62
63
64
65
66
67
68
69
70
71
72
73
74
75
76
77
78
79
80
81
82
83
84
85
86
87
88
89
90
91
92
93
94
95
96
97
98
99
100
101
102
103
104
105
106
107
108
109
110
111
112
113
114
115
116
117
118
119
120
121
122
123
124
125
126
127
128
129
130
131
132
133
134
135
136
137
138
139
140
141
142
143
144
145
146
147
148
149
150
151
152
153
154
155
156
157
158
159
160
161
162
163
164
165
166
167
168
169
170
171
172
173
174
175
176
177
178
179
| apiVersion: apps/v1
kind: Deployment
metadata:
name: prometheus
namespace: ops
labels:
k8s-app: prometheus
spec:
replicas: 1
selector:
matchLabels:
k8s-app: prometheus
template:
metadata:
labels:
k8s-app: prometheus
spec:
serviceAccountName: prometheus
initContainers:
- name: "init-chown-data"
image: "busybox:latest"
imagePullPolicy: "IfNotPresent"
command: ["chown", "-R", "65534:65534", "/data"]
volumeMounts:
- name: prometheus-data
mountPath: /data
subPath: ""
containers:
- name: prometheus-server-configmap-reload
image: "jimmidyson/configmap-reload:v0.1"
imagePullPolicy: "IfNotPresent"
args:
- --volume-dir=/etc/config
- --webhook-url=http://localhost:9090/-/reload
volumeMounts:
- name: config-volume
mountPath: /etc/config
readOnly: true
- mountPath: /etc/localtime
name: timezone
resources:
limits:
cpu: 10m
memory: 100Mi
requests:
cpu: 10m
memory: 100Mi
- name: prometheus-server
image: "prom/prometheus:v2.20.0"
imagePullPolicy: "IfNotPresent"
args:
- --config.file=/etc/config/prometheus.yml
- --storage.tsdb.path=/data
- --web.console.libraries=/etc/prometheus/console_libraries
- --web.console.templates=/etc/prometheus/consoles
- --web.enable-lifecycle
ports:
- containerPort: 9090
readinessProbe:
httpGet:
path: /-/ready
port: 9090
initialDelaySeconds: 30
timeoutSeconds: 30
livenessProbe:
httpGet:
path: /-/healthy
port: 9090
initialDelaySeconds: 30
timeoutSeconds: 30
resources:
limits:
cpu: 500m
memory: 800Mi
requests:
cpu: 200m
memory: 400Mi
volumeMounts:
- name: config-volume
mountPath: /etc/config
- name: prometheus-data
mountPath: /data
subPath: ""
- name: prometheus-rules
mountPath: /etc/config/rules
- mountPath: /etc/localtime
name: timezone
volumes:
- name: config-volume
configMap:
name: prometheus-config
- name: prometheus-rules
configMap:
name: prometheus-rules
- name: prometheus-data
persistentVolumeClaim:
claimName: prometheus
- name: timezone
hostPath:
path: /usr/share/zoneinfo/Asia/Shanghai
---
apiVersion: v1
kind: PersistentVolumeClaim
metadata:
name: prometheus
namespace: ops
spec:
storageClassName: "nfs-storage"
accessModes:
- ReadWriteMany
resources:
requests:
storage: 10Gi
---
apiVersion: v1
kind: Service
metadata:
name: prometheus
namespace: ops
spec:
type: NodePort
ports:
- name: http
port: 9090
protocol: TCP
targetPort: 9090
nodePort: 30089
selector:
k8s-app: prometheus
---
apiVersion: v1
kind: ServiceAccount
metadata:
name: prometheus
namespace: ops
---
apiVersion: rbac.authorization.k8s.io/v1
kind: ClusterRole
metadata:
name: prometheus
rules:
- apiGroups:
- ""
resources:
- nodes
- nodes/metrics
- services
- endpoints
- pods
verbs:
- get
- list
- watch
- apiGroups:
- ""
resources:
- configmaps
verbs:
- get
- nonResourceURLs:
- "/metrics"
verbs:
- get
---
apiVersion: rbac.authorization.k8s.io/v1
kind: ClusterRoleBinding
metadata:
name: prometheus
roleRef:
apiGroup: rbac.authorization.k8s.io
kind: ClusterRole
name: prometheus
subjects:
- kind: ServiceAccount
name: prometheus
namespace: ops
|
prometheus配置报警规则 prometheus-rules.yaml
1
2
3
4
5
6
7
8
9
10
11
12
13
14
15
16
17
18
19
20
21
22
23
24
25
26
27
28
29
30
31
32
33
34
35
36
37
38
39
40
41
42
43
44
45
46
47
48
49
50
51
52
53
54
55
56
57
58
59
60
61
62
63
64
65
66
67
68
69
70
71
72
73
74
75
76
77
78
79
80
81
82
83
84
85
86
87
88
89
90
91
92
93
94
95
96
97
98
99
100
101
102
103
104
105
106
107
108
109
110
111
112
113
114
115
116
117
118
119
120
121
122
123
124
125
126
127
128
129
130
131
132
133
134
135
136
137
138
139
140
141
142
143
144
145
146
147
148
149
150
151
152
153
154
155
156
157
158
159
160
161
162
163
164
165
166
167
168
169
170
171
172
173
174
175
176
177
178
179
180
181
182
183
184
185
186
187
188
189
190
191
192
193
194
195
196
197
198
199
200
201
202
203
204
205
206
207
208
209
210
211
| apiVersion: v1
kind: ConfigMap
metadata:
name: prometheus-rules
namespace: ops
data:
general.rules: |
groups:
- name: general.rules
rules:
- alert: InstanceDown
expr: up == 0
for: 1m
labels:
severity: error
annotations:
summary: "Instance {{ $labels.instance }} 停止工作"
description: "{{ $labels.instance }} job {{ $labels.job }} 已经停止5分钟以上."
node.rules: |
groups:
- name: node.rules
rules:
- alert: NodeFilesystemUsage
expr: |
100 - (node_filesystem_free_bytes / node_filesystem_size_bytes) * 100 > 60
for: 1m
labels:
severity: warning
annotations:
summary: "Instance {{ $labels.instance }} : {{ $labels.mountpoint }} 分区使用率过高"
description: "{{ $labels.instance }}: {{ $labels.mountpoint }} 分区使用大于60% (当前值: {{ $value }})"
- alert: NodeMemoryUsage
expr: |
100 - (node_memory_MemFree_bytes+node_memory_Cached_bytes+node_memory_Buffers_bytes) / node_memory_MemTotal_bytes * 100 > 60
for: 1m
labels:
severity: warning
annotations:
summary: "Instance {{ $labels.instance }} 内存使用率过高"
description: "{{ $labels.instance }}内存使用大于60% (当前值: {{ $value }})"
- alert: NodeCPUUsage
expr: |
100 - (avg(irate(node_cpu_seconds_total{mode="idle"}[5m])) by (instance) * 100) > 60
for: 1m
labels:
severity: warning
annotations:
summary: "Instance {{ $labels.instance }} CPU使用率过高"
description: "{{ $labels.instance }}CPU使用大于60% (当前值: {{ $value }})"
- alert: KubeNodeNotReady
expr: |
kube_node_status_condition{condition="Ready",status="true"} == 0
for: 1m
labels:
severity: error
annotations:
message: '{{ $labels.node }} 已经有10多分钟没有准备好了.'
pod.rules: |
groups:
- name: pod.rules
rules:
- alert: PodCPUUsage
expr: |
sum by(pod, namespace) (rate(container_cpu_usage_seconds_total{image!=""}[5m]) * 100) > 5
for: 5m
labels:
severity: warning
annotations:
summary: "命名空间: {{ $labels.namespace }} | Pod名称: {{ $labels.pod }} CPU使用大于80% (当前值: {{ $value }})"
- alert: PodMemoryUsage
expr: |
sum(container_memory_rss{image!=""}) by(pod, namespace) / sum(container_spec_memory_limit_bytes{image!=""}) by(pod, namespace) * 100 != +inf > 80
for: 5m
labels:
severity: error
annotations:
summary: "命名空间: {{ $labels.namespace }} | Pod名称: {{ $labels.pod }} 内存使用大于80% (当前值: {{ $value }})"
- alert: PodNetworkReceive
expr: |
sum(rate(container_network_receive_bytes_total{image!="",name=~"^k8s_.*"}[5m]) /1000) by (pod,namespace) > 30000
for: 5m
labels:
severity: warning
annotations:
summary: "命名空间: {{ $labels.namespace }} | Pod名称: {{ $labels.pod }} 入口流量大于30MB/s (当前值: {{ $value }}K/s)"
- alert: PodNetworkTransmit
expr: |
sum(rate(container_network_transmit_bytes_total{image!="",name=~"^k8s_.*"}[5m]) /1000) by (pod,namespace) > 30000
for: 5m
labels:
severity: warning
annotations:
summary: "命名空间: {{ $labels.namespace }} | Pod名称: {{ $labels.pod }} 出口流量大于30MB/s (当前值: {{ $value }}/K/s)"
- alert: PodRestart
expr: |
sum(changes(kube_pod_container_status_restarts_total[1m])) by (pod,namespace) > 0
for: 1m
labels:
severity: warning
annotations:
summary: "命名空间: {{ $labels.namespace }} | Pod名称: {{ $labels.pod }} Pod重启 (当前值: {{ $value }})"
- alert: PodFailed
expr: |
sum(kube_pod_status_phase{phase="Failed"}) by (pod,namespace) > 0
for: 5s
labels:
severity: error
annotations:
summary: "命名空间: {{ $labels.namespace }} | Pod名称: {{ $labels.pod }} Pod状态Failed (当前值: {{ $value }})"
- alert: PodPending
expr: |
sum(kube_pod_status_phase{phase="Pending"}) by (pod,namespace) > 0
for: 1m
labels:
severity: error
annotations:
summary: "命名空间: {{ $labels.namespace }} | Pod名称: {{ $labels.pod }} Pod状态Pending (当前值: {{ $value }})"
- alert: PodErrImagePull
expr: |
sum by(namespace,pod) (kube_pod_container_status_waiting_reason{reason="ErrImagePull"}) == 1
for: 1m
labels:
severity: warning
annotations:
summary: "命名空间: {{ $labels.namespace }} | Pod名称: {{ $labels.pod }} Pod状态ErrImagePull (当前值: {{ $value }})"
- alert: PodImagePullBackOff
expr: |
sum by(namespace,pod) (kube_pod_container_status_waiting_reason{reason="ImagePullBackOff"}) == 1
for: 1m
labels:
severity: warning
annotations:
summary: "命名空间: {{ $labels.namespace }} | Pod名称: {{ $labels.pod }} Pod状态ImagePullBackOff (当前值: {{ $value }})"
- alert: PodCrashLoopBackOff
expr: |
sum by(namespace,pod) (kube_pod_container_status_waiting_reason{reason="CrashLoopBackOff"}) == 1
for: 1m
labels:
severity: warning
annotations:
summary: "命名空间: {{ $labels.namespace }} | Pod名称: {{ $labels.pod }} Pod状态CrashLoopBackOff (当前值: {{ $value }})"
- alert: PodInvalidImageName
expr: |
sum by(namespace,pod) (kube_pod_container_status_waiting_reason{reason="InvalidImageName"}) == 1
for: 1m
labels:
severity: warning
annotations:
summary: "命名空间: {{ $labels.namespace }} | Pod名称: {{ $labels.pod }} Pod状态InvalidImageName (当前值: {{ $value }})"
- alert: PodCreateContainerConfigError
expr: |
sum by(namespace,pod) (kube_pod_container_status_waiting_reason{reason="CreateContainerConfigError"}) == 1
for: 1m
labels:
severity: warning
annotations:
summary: "命名空间: {{ $labels.namespace }} | Pod名称: {{ $labels.pod }} Pod状态CreateContainerConfigError (当前值: {{ $value }})"
volume.rules: |
groups:
- name: volume.rules
rules:
- alert: PersistentVolumeClaimLost
expr: |
sum by(namespace, persistentvolumeclaim) (kube_persistentvolumeclaim_status_phase{phase="Lost"}) == 1
for: 2m
labels:
severity: warning
annotations:
summary: "PersistentVolumeClaim {{ $labels.namespace }}/{{ $labels.persistentvolumeclaim }} is lost\n VALUE = {{ $value }}\n LABELS = {{ $labels }}"
- alert: PersistentVolumeClaimPendig
expr: |
sum by(namespace, persistentvolumeclaim) (kube_persistentvolumeclaim_status_phase{phase="Pendig"}) == 1
for: 2m
labels:
severity: warning
annotations:
summary: "PersistentVolumeClaim {{ $labels.namespace }}/{{ $labels.persistentvolumeclaim }} is pendig\n VALUE = {{ $value }}\n LABELS = {{ $labels }}"
- alert: PersistentVolume Failed
expr: |
sum(kube_persistentvolume_status_phase{phase="Failed",job="kubernetes-service-endpoints"}) by (persistentvolume) == 1
for: 2m
labels:
severity: warning
annotations:
summary: "Persistent volume is failed state\n VALUE = {{ $value }}\n LABELS = {{ $labels }}"
- alert: PersistentVolume Pending
expr: |
sum(kube_persistentvolume_status_phase{phase="Pending",job="kubernetes-service-endpoints"}) by (persistentvolume) == 1
for: 2m
labels:
severity: warning
annotations:
summary: "Persistent volume is pending state\n VALUE = {{ $value }}\n LABELS = {{ $labels }}"
|
node-exporter配置node-exporter.yaml(注意版本需要用1.0.1)
1
2
3
4
5
6
7
8
9
10
11
12
13
14
15
16
17
18
19
20
21
22
23
24
25
26
27
28
29
30
31
32
33
34
35
36
37
38
39
40
41
42
43
44
45
46
47
48
49
50
51
52
53
54
55
56
57
58
59
60
61
62
63
64
65
66
67
68
69
70
71
72
73
74
75
76
77
| apiVersion: apps/v1
kind: DaemonSet
metadata:
name: node-exporter
namespace: ops
labels:
k8s-app: node-exporter
spec:
selector:
matchLabels:
k8s-app: node-exporter
version: v1.0.1
template:
metadata:
labels:
k8s-app: node-exporter
version: v1.0.1
spec:
containers:
- name: prometheus-node-exporter
image: "prom/node-exporter:v1.0.1"
#imagePullPolicy: "Always"
args:
- --path.procfs=/host/proc
- --path.sysfs=/host/sys
ports:
- name: metrics
containerPort: 9100
hostPort: 9100
volumeMounts:
- name: proc
mountPath: /host/proc
readOnly: true
- name: sys
mountPath: /host/sys
readOnly: true
resources:
limits:
cpu: 10m
memory: 50Mi
requests:
cpu: 10m
memory: 50Mi
hostNetwork: true
hostPID: true
hostIPC: true
volumes:
- name: proc
hostPath:
path: /proc
- name: sys
hostPath:
path: /sys
- name: rootfs
hostPath:
path: /
- name: dev
hostPath:
path: /dev
---
apiVersion: v1
kind: Service
metadata:
name: node-exporter
namespace: ops
annotations:
prometheus.io/scrape: "true"
spec:
clusterIP: None
ports:
- name: metrics
port: 9100
protocol: TCP
targetPort: 9100
selector:
k8s-app: node-exporter
|
alertmanager yaml文件
alertmanager配置文件alertmanger-configmap.yaml
注:邮箱需要自己去网易邮箱申请并且取得授权管理密码
1
2
3
4
5
6
7
8
9
10
11
12
13
14
15
16
17
18
19
20
21
22
23
24
25
26
27
28
29
30
31
32
33
34
35
36
37
38
39
40
41
42
43
44
45
46
47
48
49
50
51
52
53
| apiVersion: v1
kind: ConfigMap
metadata:
name: alertmanager-config
namespace: ops
data:
alertmanager.yml: |-
global:
# 在没有报警的情况下声明为已解决的时间
resolve_timeout: 5m
# 配置邮件发送信息
smtp_smarthost: 'smtp.163.com:465'
smtp_from: 'xxx@163.com'
smtp_auth_username: 'xxx@163.com'
smtp_auth_password: 'xxxxxx'
smtp_hello: '163.com'
smtp_require_tls: false
# 所有报警信息进入后的根路由,用来设置报警的分发策略
route:
# 这里的标签列表是接收到报警信息后的重新分组标签,例如,接收到的报警信息里面有许多具有 cluster=A 和 alertname=LatncyHigh 这样的标签的报警信息将会批量被聚合到一个分组里面
group_by: ['alertname', 'cluster']
# 当一个新的报警分组被创建后,需要等待至少group_wait时间来初始化通知,这种方式可以确保您能有足够的时间为同一分组来获取多个警报,然后一起触发这个报警信息。
group_wait: 30s
# 当第一个报警发送后,等待'group_interval'时间来发送新的一组报警信息。
group_interval: 5m
# 如果一个报警信息已经发送成功了,等待'repeat_interval'时间来重新发送他们
repeat_interval: 5m
# 默认的receiver:如果一个报警没有被一个route匹配,则发送给默认的接收器
receiver: default
# 上面所有的属性都由所有子路由继承,并且可以在每个子路由上进行覆盖。
routes:
- receiver: email
group_wait: 10s
match:
team: node
templates:
- '/etc/config/template/email.tmpl'
receivers:
- name: 'default'
email_configs:
- to: 'xxxx@qq.com'
html: '{{ template "email.html" . }}'
headers: { Subject: "[WARN] Prometheus 告警邮件" }
#send_resolved: true
- name: 'email'
email_configs:
- to: 'xxxx@gmail.com'
send_resolved: true
|
alertmanager template文件alertmanager-template.yaml
1
2
3
4
5
6
7
8
9
10
11
12
13
14
15
16
17
18
19
20
21
22
23
24
25
| #自定义告警模板
apiVersion: v1
kind: ConfigMap
metadata:
name: alertmanager-template-volume
namespace: ops
data:
email.tmpl: |
{{ define "email.html" }}
{{ range .Alerts }}
<pre>
========start==========
告警程序: prometheus_alert_email
告警级别: {{ .Labels.severity }} 级别
告警类型: {{ .Labels.alertname }}
故障主机: {{ .Labels.instance }}
告警主题: {{ .Annotations.summary }}
告警详情: {{ .Annotations.description }}
处理方法: {{ .Annotations.console }}
触发时间: {{ .StartsAt.Format "2006-01-02 15:04:05" }}
========end==========
</pre>
{{ end }}
{{ end }}
|
alertmanager部署文件alertmanager-deployment.yaml
1
2
3
4
5
6
7
8
9
10
11
12
13
14
15
16
17
18
19
20
21
22
23
24
25
26
27
28
29
30
31
32
33
34
35
36
37
38
39
40
41
42
43
44
45
46
47
48
49
50
51
52
53
54
55
56
57
58
59
60
61
62
63
64
65
66
67
68
69
70
71
72
73
74
75
76
77
78
79
80
81
82
83
84
85
86
87
88
89
90
91
92
93
94
95
96
97
98
99
100
101
102
103
104
105
106
107
108
109
110
111
112
113
114
115
116
| apiVersion: apps/v1
kind: Deployment
metadata:
name: alertmanager
namespace: ops
spec:
replicas: 1
selector:
matchLabels:
k8s-app: alertmanager
version: v0.14.0
template:
metadata:
labels:
k8s-app: alertmanager
version: v0.14.0
spec:
containers:
- name: prometheus-alertmanager
image: "prom/alertmanager:v0.14.0"
imagePullPolicy: "IfNotPresent"
args:
- --config.file=/etc/config/alertmanager.yml
- --storage.path=/data
- --web.external-url=/
ports:
- containerPort: 9093
readinessProbe:
httpGet:
path: /#/status
port: 9093
initialDelaySeconds: 30
timeoutSeconds: 30
volumeMounts:
- name: config-volume
mountPath: /etc/config
#自定义告警模板
- name: config-template-volume
mountPath: /etc/config/template
- name: storage-volume
mountPath: "/data"
subPath: ""
- mountPath: /etc/localtime
name: timezone
resources:
limits:
cpu: 10m
memory: 200Mi
requests:
cpu: 10m
memory: 100Mi
- name: prometheus-alertmanager-configmap-reload
image: "jimmidyson/configmap-reload:v0.1"
imagePullPolicy: "IfNotPresent"
args:
- --volume-dir=/etc/config
- --webhook-url=http://localhost:9093/-/reload
volumeMounts:
- name: config-volume
mountPath: /etc/config
readOnly: true
resources:
limits:
cpu: 10m
memory: 200Mi
requests:
cpu: 10m
memory: 100Mi
volumes:
- name: config-volume
configMap:
name: alertmanager-config
- name: config-template-volume
configMap:
name: alertmanager-template-volume
- name: storage-volume
persistentVolumeClaim:
claimName: alertmanager
- name: timezone
hostPath:
path: /usr/share/zoneinfo/Asia/Shanghai
---
apiVersion: v1
kind: PersistentVolumeClaim
metadata:
name: alertmanager
namespace: ops
spec:
storageClassName: nfs-storage
accessModes:
- ReadWriteOnce
resources:
requests:
storage: "2Gi"
---
apiVersion: v1
kind: Service
metadata:
name: alertmanager
namespace: ops
labels:
kubernetes.io/cluster-service: "true"
addonmanager.kubernetes.io/mode: Reconcile
kubernetes.io/name: "Alertmanager"
spec:
type: "NodePort"
ports:
- name: http
port: 80
protocol: TCP
targetPort: 9093
nodePort: 30093
selector:
k8s-app: alertmanager
|
grafana yaml文件
1
2
3
4
5
6
7
8
9
10
11
12
13
14
15
16
17
18
19
20
21
22
23
24
25
26
27
28
29
30
31
32
33
34
35
36
37
38
39
40
41
42
43
44
45
46
47
48
49
50
51
52
53
54
55
56
57
58
59
60
61
62
63
64
65
66
67
68
69
70
71
72
| apiVersion: apps/v1
kind: Deployment
metadata:
name: grafana
namespace: ops
spec:
replicas: 1
selector:
matchLabels:
app: grafana
template:
metadata:
labels:
app: grafana
spec:
containers:
- name: grafana
image: grafana/grafana:7.1.0
ports:
- containerPort: 3000
protocol: TCP
resources:
limits:
cpu: 100m
memory: 256Mi
requests:
cpu: 100m
memory: 256Mi
volumeMounts:
- name: grafana-data
mountPath: /var/lib/grafana
subPath: grafana
- mountPath: /etc/localtime
name: timezone
securityContext:
fsGroup: 472
runAsUser: 472
volumes:
- name: grafana-data
persistentVolumeClaim:
claimName: grafana
- name: timezone
hostPath:
path: /usr/share/zoneinfo/Asia/Shanghai
---
apiVersion: v1
kind: PersistentVolumeClaim
metadata:
name: grafana
namespace: ops
spec:
storageClassName: "nfs-storage"
accessModes:
- ReadWriteMany
resources:
requests:
storage: 5Gi
---
apiVersion: v1
kind: Service
metadata:
name: grafana
namespace: ops
spec:
type: NodePort
ports:
- port : 80
targetPort: 3000
nodePort: 30030
selector:
app: grafana
|
部署到k8s中
grafana数据源和监控
grafana添加数据源
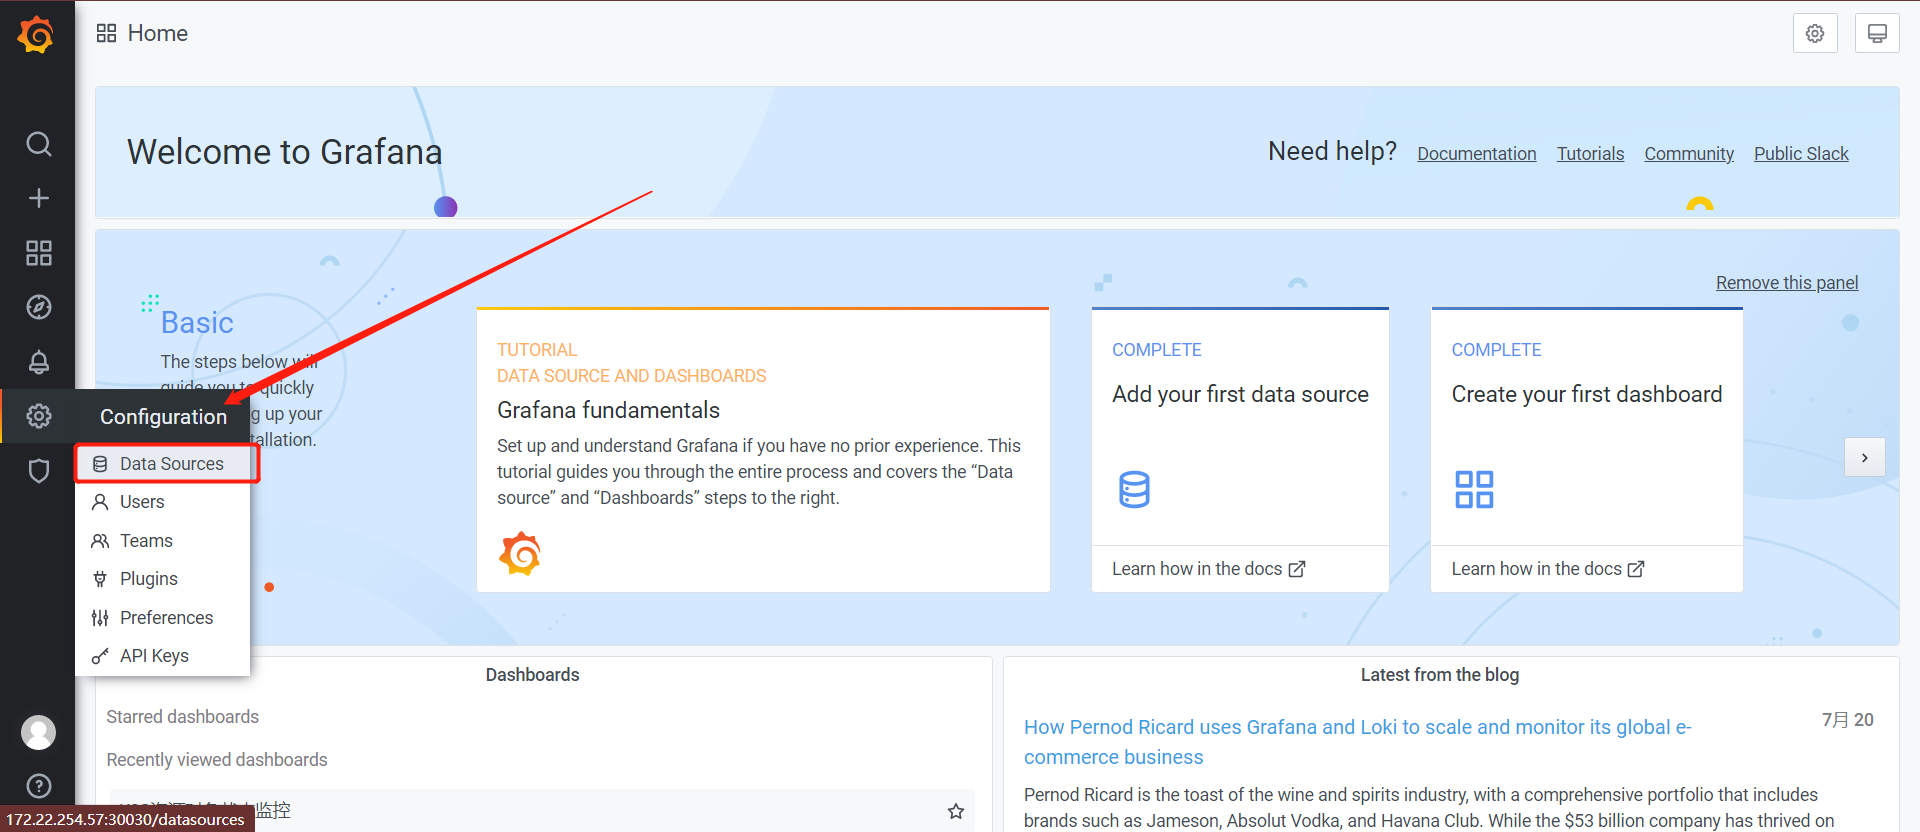
点击datasource - add datasource
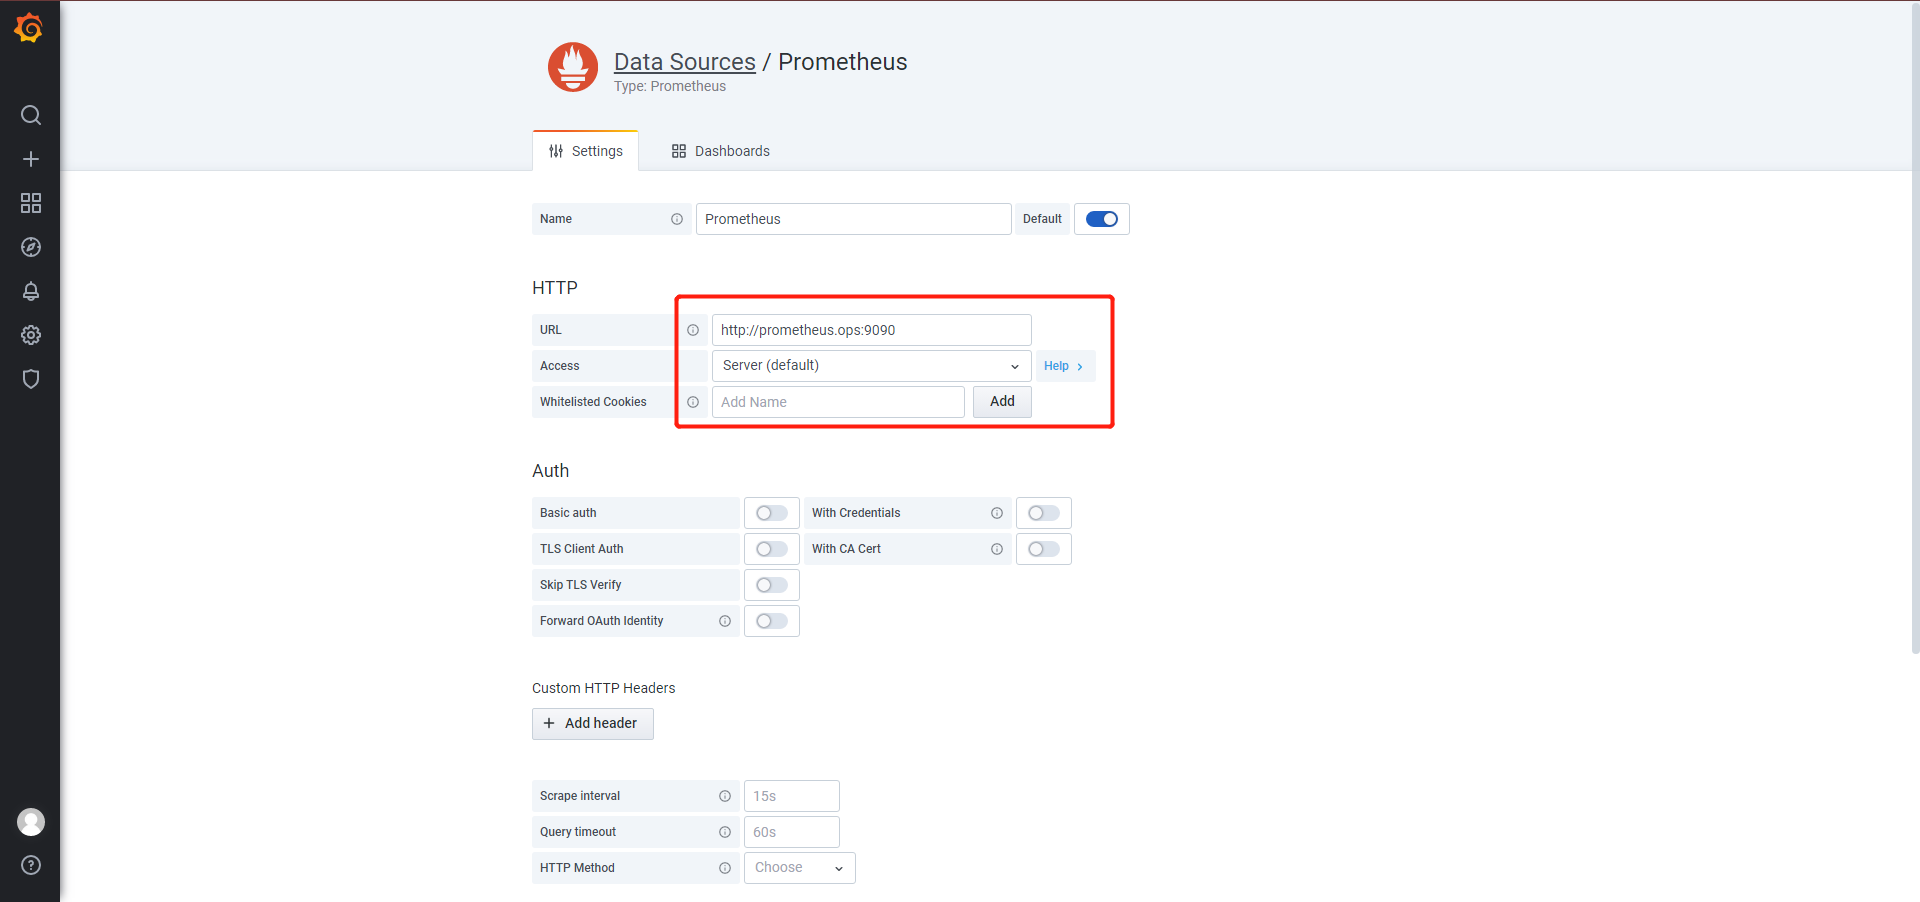
之后点击save&test,添加数据源结束
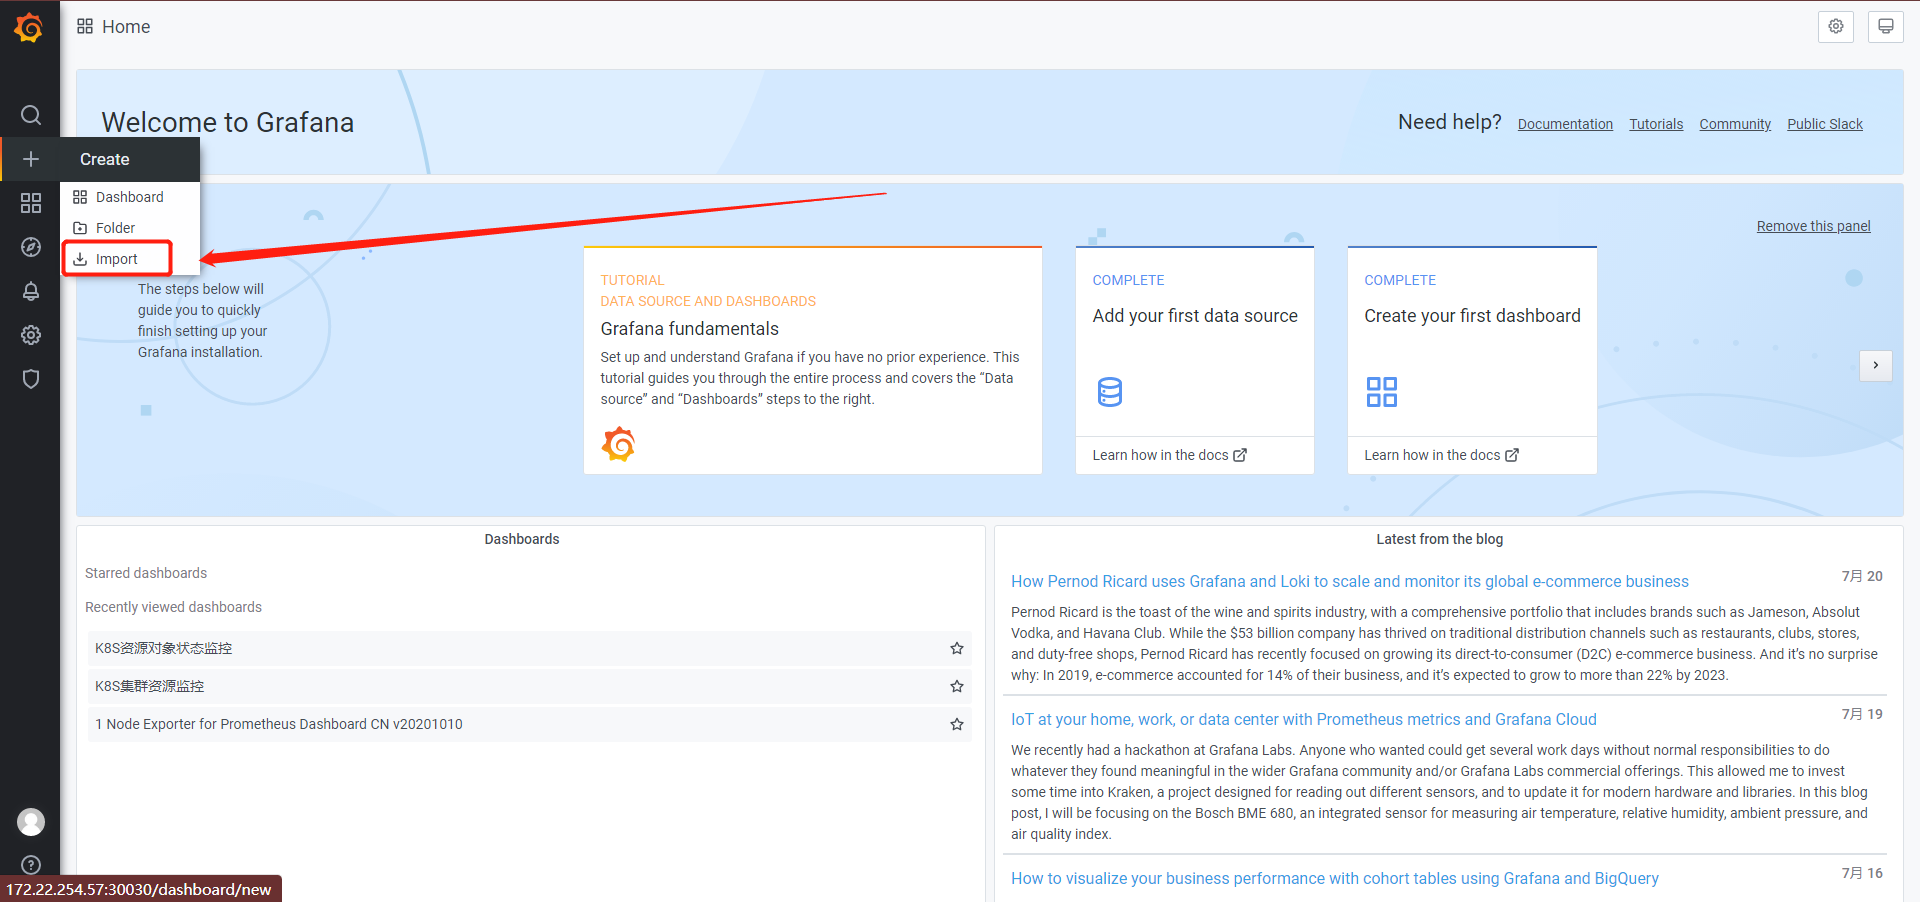
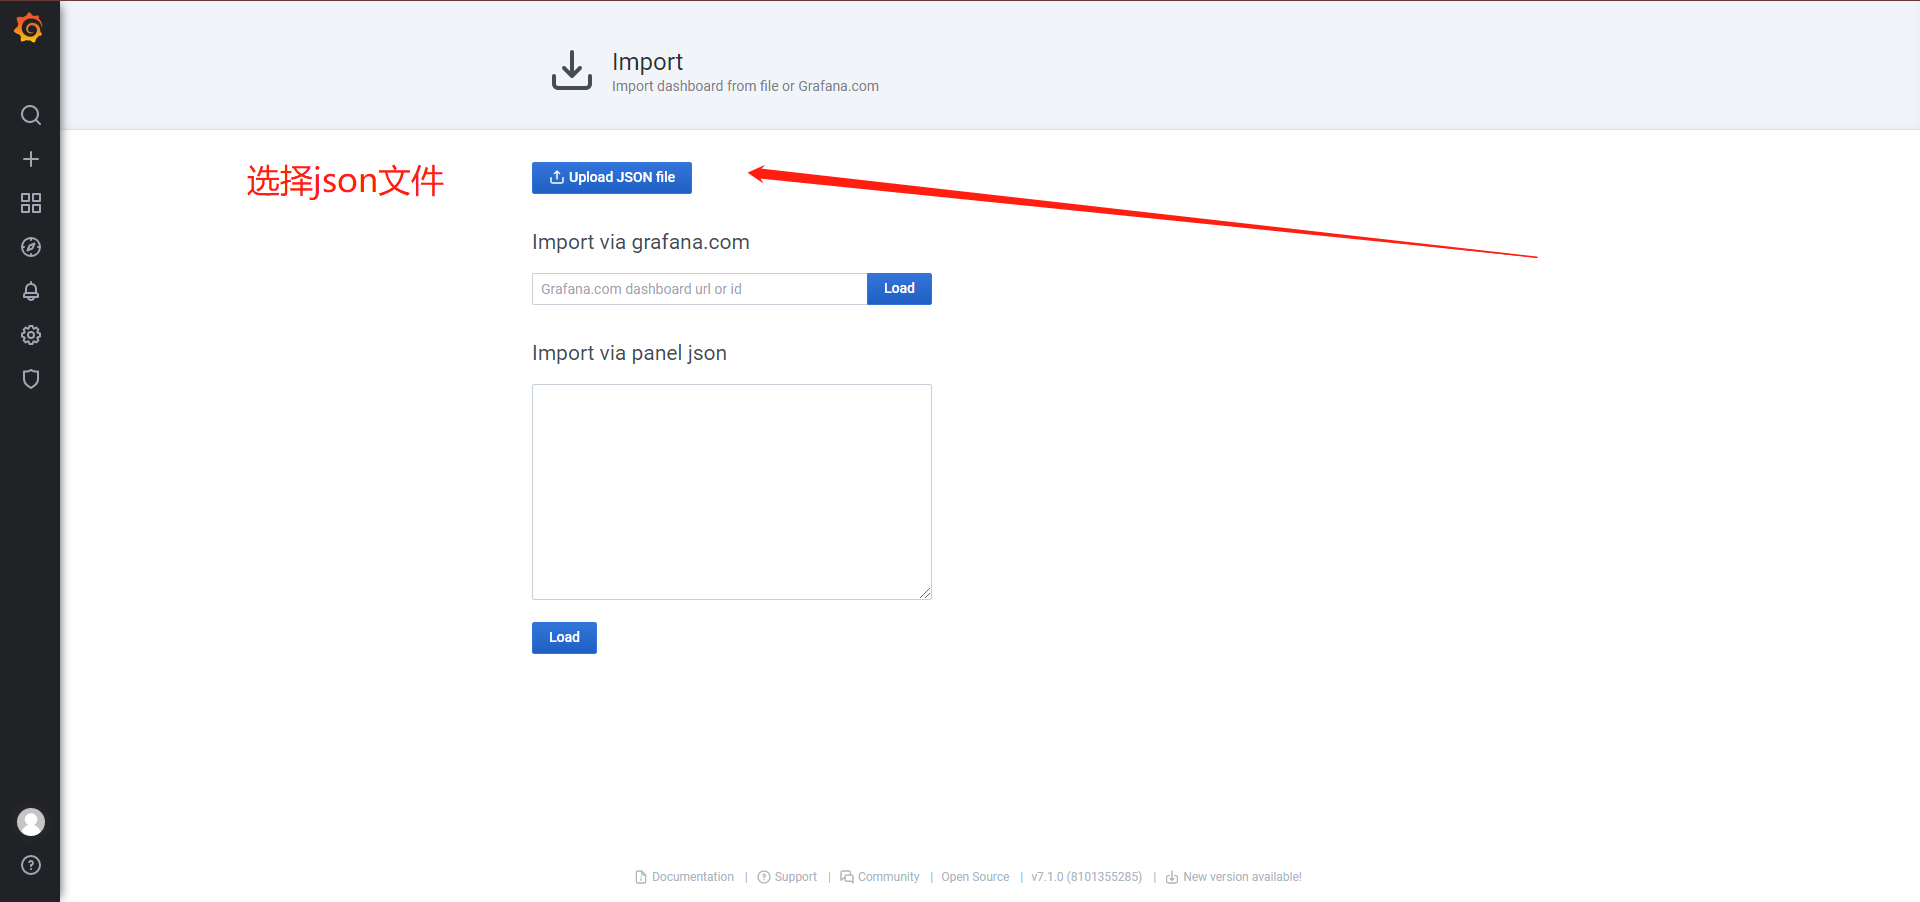
import导入模板
模板下载:https://github.com/alexclownfish/k8s-monitor/tree/main/grafana_template
修改prometheus rules验证监控触发报警并发送邮件
修改prometheus-rules.yaml
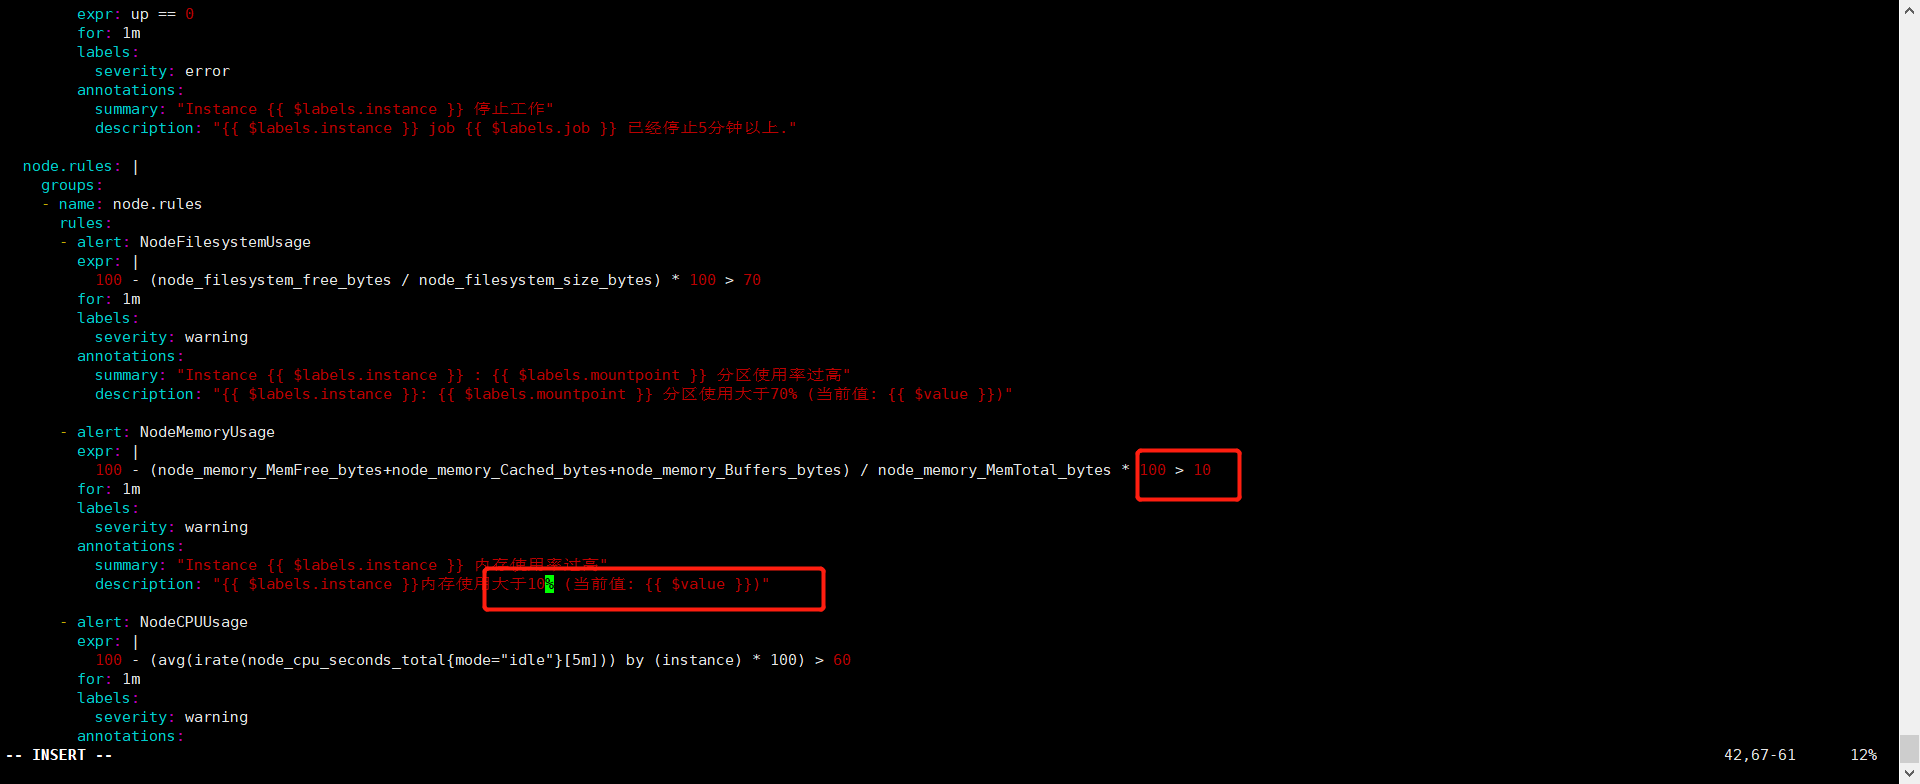
1
2
3
| #热更新configmap
kubectl apply -f prometheus-rules.yaml
curl -X POST http://10.1.230.219:9090/-/reload
|
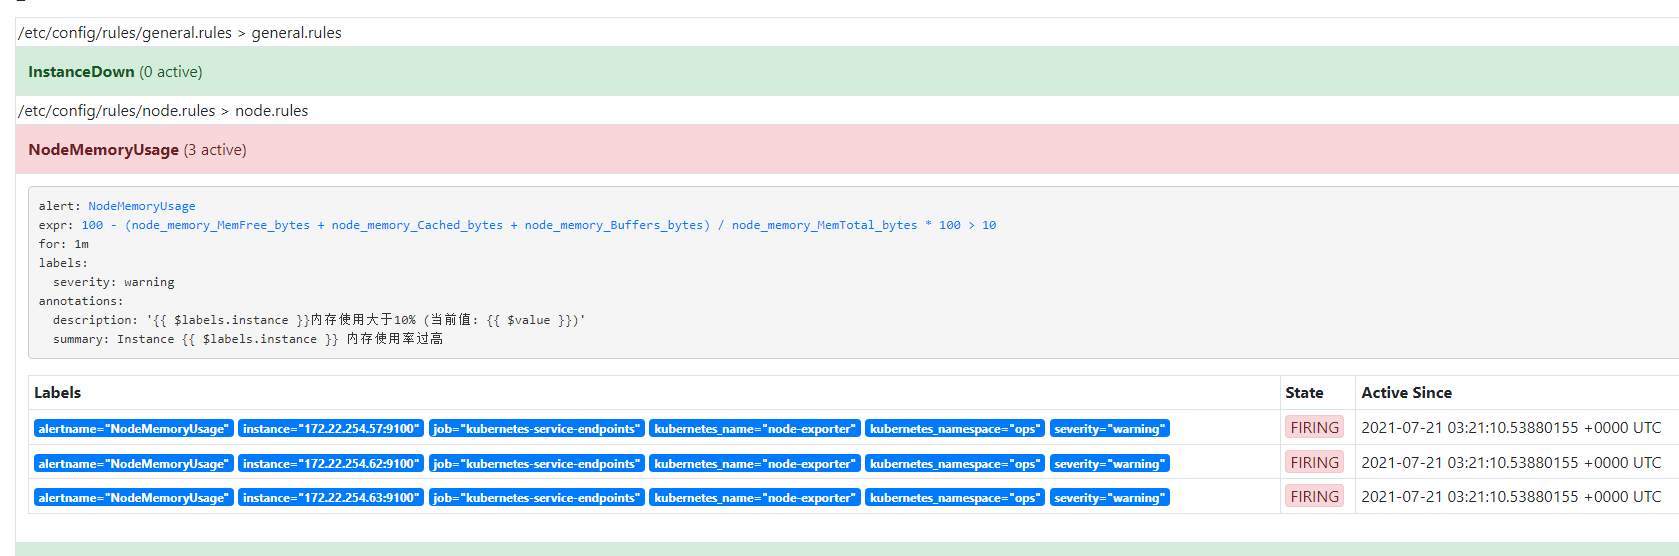
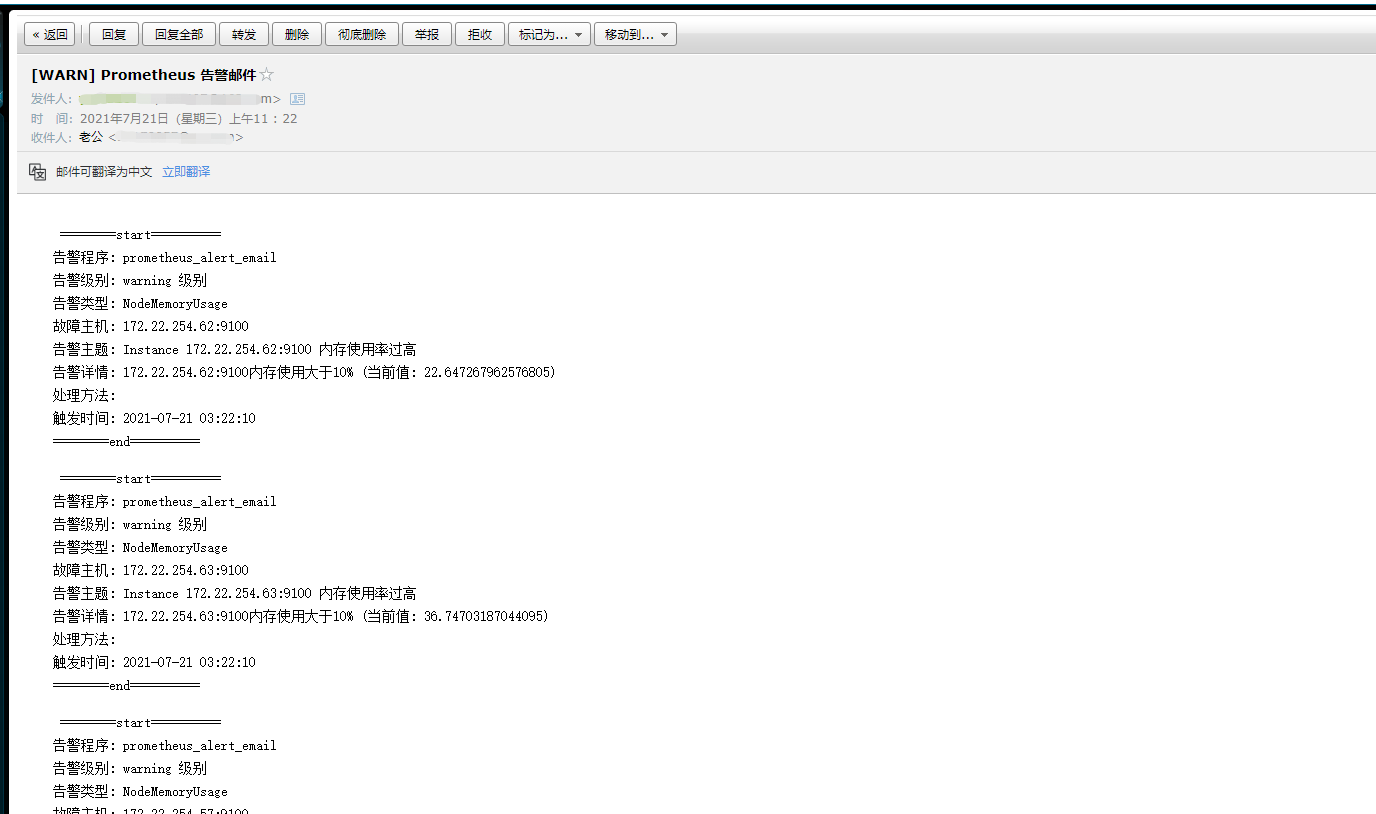
看到已经触发报警并发送邮件
至此结束
感谢大佬
https://blog.51cto.com/luoguoling
https://alexcld.com